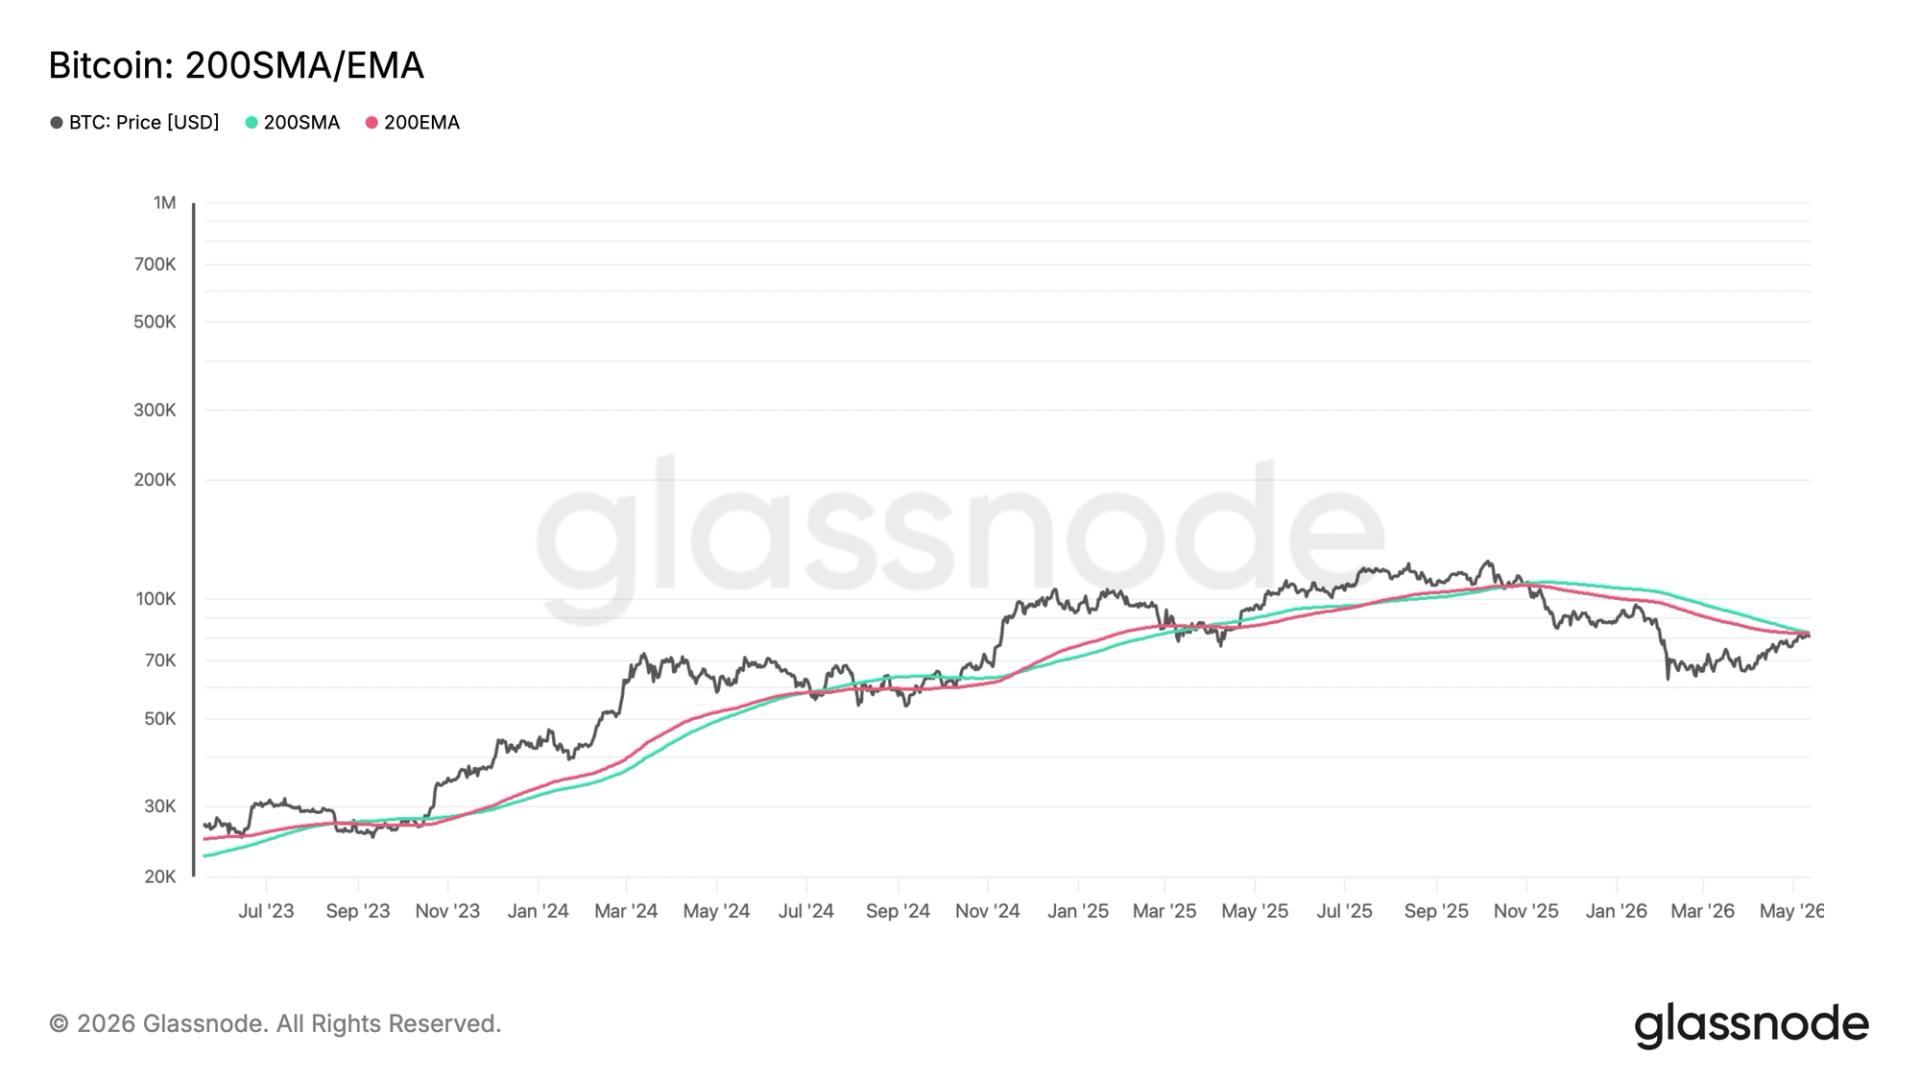
Bitcoin is currently trading just below two significant long-term trend indicators: the 200-day Simple Moving Average (200SMA) at $82,455 and the 200-day Exponential Moving Average (200EMA) at $82,027, as reported by Glassnode. This positioning places Bitcoin in a critical technical phase, with the confluence of these averages creating a resistance zone between $82,000 and $82,500.
The 200SMA calculates the average closing price over the past 200 days, treating each day equally, while the 200EMA gives greater weight to more recent prices, making it more responsive to current market dynamics. For Bitcoin to signal a recovery of its long-term uptrend, it must convincingly reclaim this resistance zone.
Bitcoin first fell below the 200DMA in late November 2025, when its price dropped from $108,000. A subsequent recovery attempt in January 2026 failed to regain this level, with Bitcoin falling to around $60,000 by early February.
Despite these challenges, there are indicators that may provide some cautious optimism for investors. Bitcoin is currently trading above several key cost basis levels, according to CheckonChain. The 128-day Moving Average stands at $75,700, representing the average price paid by buyers over that period, a level that Bitcoin has managed to defend successfully.
Additionally, the True Market Mean, which is at $78,200, reflects the average price of every Bitcoin at the time it last moved on-chain, representing the aggregate cost basis of the active market. The Short-Term Holder Cost Basis, currently at $78,400, tracks the average acquisition price of investors who purchased within the last 155 days, a group that has historically been prone to panic selling when their investments are underwater.
Bitcoin’s trading above these three indicators suggests that most recent buyers are currently in profit, which may reduce the likelihood of forced liquidations or panic selling. The critical area to monitor is whether Bitcoin can convert the $82,000-$82,500 resistance zone into support.
In related developments, XRP has seen a surge in trading volume, becoming the most traded pair on Upbit and ranking high on Bithumb. Despite this volume increase, XRP’s price has remained relatively stable, trading between $1.44 and $1.45.
Bitcoin is navigating a critical technical phase as it trades below key long-term averages, with indicators suggesting cautious optimism for investors. Meanwhile, XRP experiences a surge in trading volume without significant price movement.