“Hedera faces selling pressure at $0.2055 resistance as trading volume explodes 137% above average, marking institutional distribution amid choppy price action.”, — write: www.coindesk.com
A surge in trading volume to 249 million tokens—137% above average—confirmed heavy distribution at the $0.2055 level, suggesting institutional selling. Support at $0.1938 has held through repeated tests, but a series of lower highs at $0.2044, $0.2032, and $0.2017 signals persistent bearish momentum.
Intraday volatility intensified between 13:33 and 13:48, with sharp swings from $0.2015 to $0.2029 amid bursts of 20.6 million tokens. Trading abruptly halted at 14:16, pointing to possible market disruption or data issues. The $0.2014 pivot now serves as a key level as traders watch whether HBAR’s $0.1938 support can withstand continued pressure.
The price action follows Tuesday’s launch of a spot HBAR ETF on the Nasdaq, which led to a significant intraday increase in HBAR.
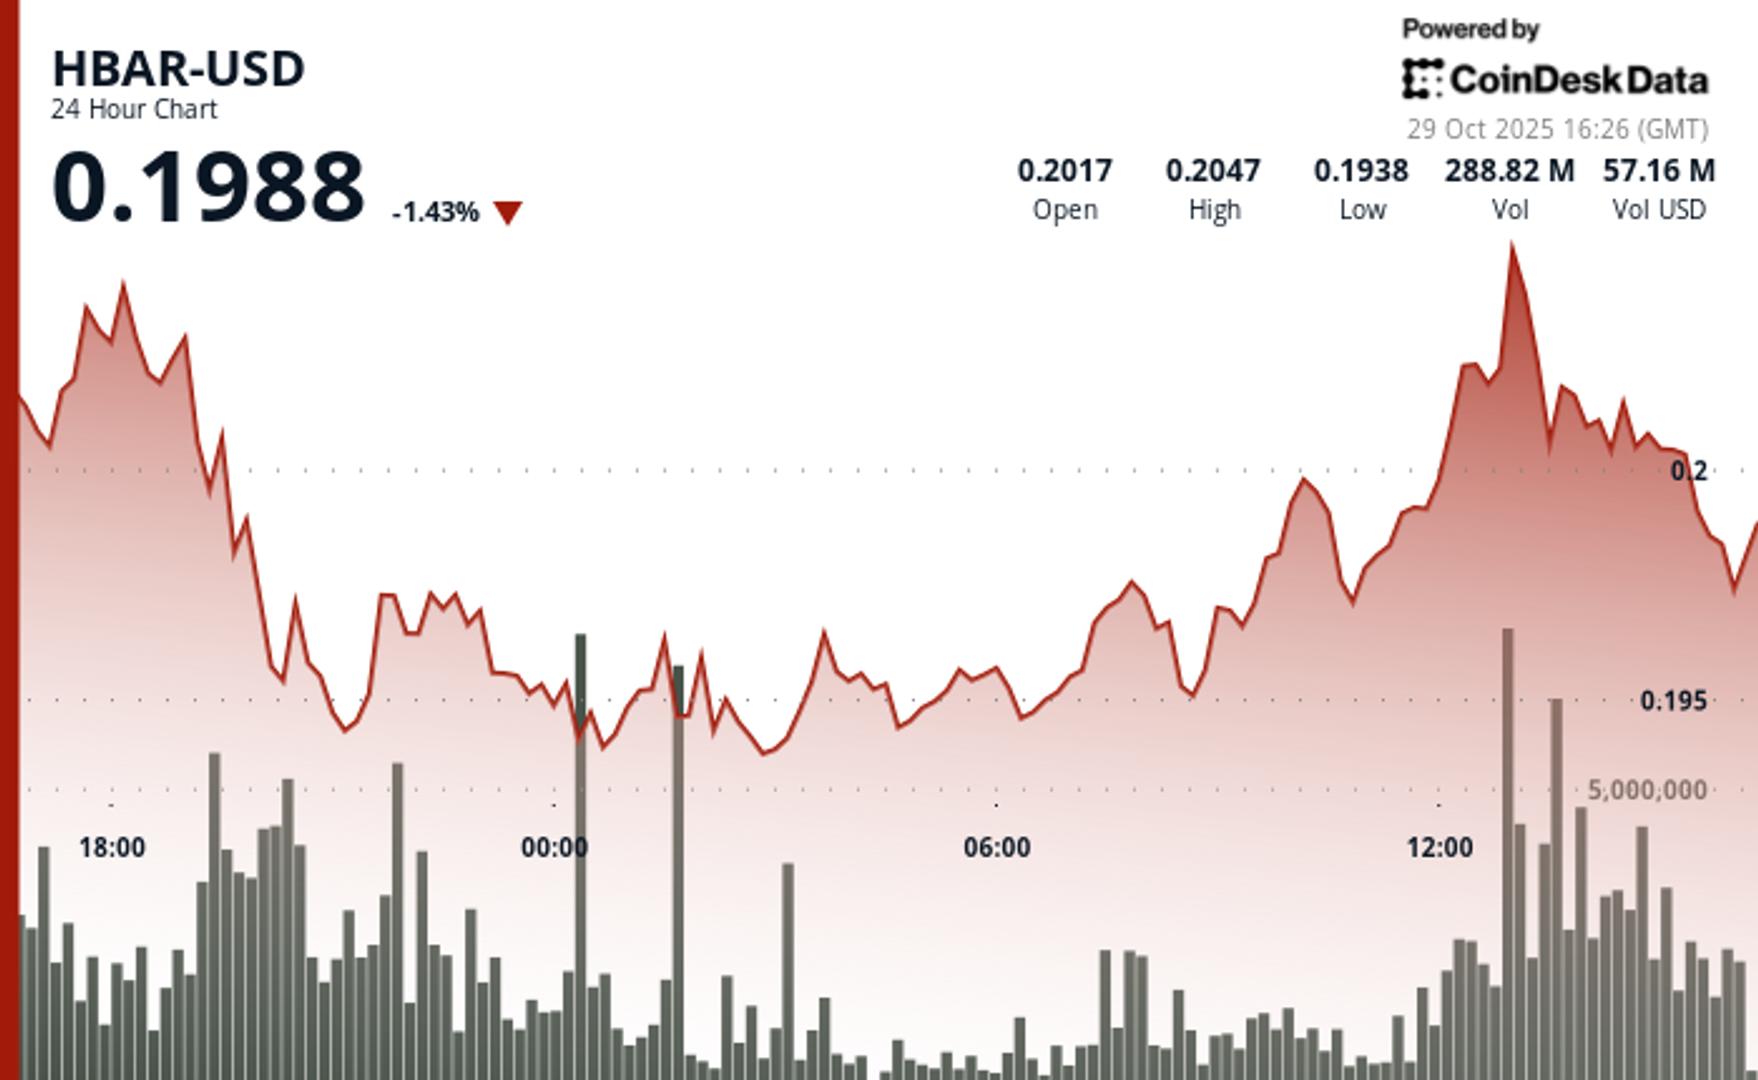
 HBAR/USD (TradingView)
HBAR Technical Overview
- Support / Resistance
- Key support at $0.1938 has held through multiple tests.
- Strong resistance at $0.2055 remains unbroken after repeated high-volume rejections.
- Volume Analysis
- Recent 249M token volume spike marks a 137% increase over the average.
- Indicates institutional selling pressure and distribution concentrated near resistance.
- Chart Patterns
- Descending trendline confirms bearish momentum with successive lower highs at:
- $0.2044
- $0.2032
- $0.2017
- Price action remains range-bound, but momentum favors sellers.
- Descending trendline confirms bearish momentum with successive lower highs at:
- Targets / Risk-Reward
- Downside target: Break below $0.1938 support could trigger further weakness.
- Upside potential: Recovery faces resistance at $0.2017 and major supply near $0.2055.
Disclaimer: Parts of this article were generated with the assistance from AI tools and reviewed by our editorial team to ensure accuracy and adherence to our standards. For more information, see CoinDesk’s full AI Policy.
 Stablecoin payment volumes have grown to $19.4B year-to-date in 2025. OwlTing aims to capture this market by developing payment infrastructure that processes transactions in seconds for fractions of a cent.
View Full Report
 XLM demonstrates resilience with modest gains and exceptional volume surge, signaling potential momentum building beneath current consolidation patterns.
- XLM advanced 1.53% to $0.319 on volume exceeding 30-day average by 134%.
- Technical analysis reveals controlled institutional buying without speculative excess.
- Protocol 24 upgrade expectations and RWA tokenization growth support sentiment.
Read full story