
“After two years of growth, the cryptocurrency king ended 2025 with a 6% decline. Bitcoin is currently on a three-month losing streak, but 2026 begins with a rally above $90,000. And if the resistance at $94,000 is breached, the price of BTC could accelerate towards the psychological $100,000 mark. Will it be at the beginning? […]”, — write: businessua.com.ua

After two years of growth, the cryptocurrency king ended 2025 with a 6% decline. Bitcoin is currently on a three-month losing streak, but 2026 begins with a rally above $90,000. And if the resistance at $94,000 is breached, the price of BTC could accelerate towards the psychological $100,000 mark. Will capital move to safe assets or riskier assets at the start of this year? In the “Macrofocus” section, we analyze the situation with certain safe and risky ones assets to gain insight into investor behavior. Let’s start!
Bitcoin recovers and holds the $90,000 support level At the end of 2025, sellers regained control over the price of Bitcoin. Pressure from sellers has been strong for several weeks, but buyers have been defensive the $90,000 support level . Now the price is trying to break through bearish 9-day and 18-day moving averages (EMA 18) .
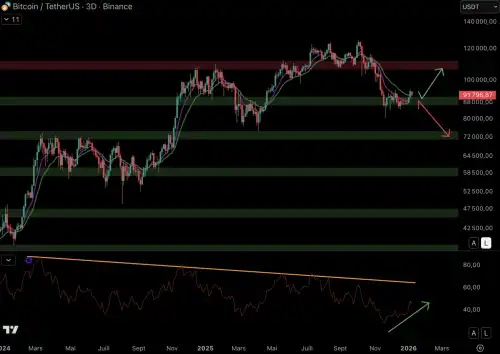
Bitcoin Price Against Dollar (3D) – Sign up for TradingView using our affiliate link.
If buyers maintain control, the price may rise to resistance level around $110,000. Conversely, if the price loses momentum and falls below this support, it could provoke downward movement . The next support level for BTC on this timeframe is $73,000 .
The RSI momentum indicator is returning to the downward trend line. As long as the RSI remains below this trend line, momentum is volatile .
The dollar is fluctuating and gold is rising again The dollar has been moving sideways for several months. In 2025, the dollar index dropped sharply . However, it has been several months the dollar is trading in a sideways square and does not show a clear trend . After deviation from resistance level at 101 the price bounced from support level at 97.5 .
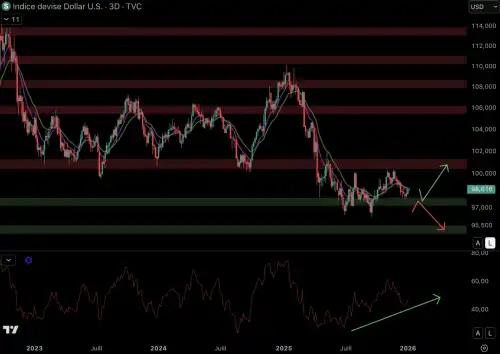
Dollar Index Chart (3D) – Sign up for TradingView using our affiliate link.
If the dollar continues its recovery, it may return to resistance level at 101. Conversely, if the price stops relative to the moving averages (9-day/18-day EMA) and falls below the support level, it may find support at 95. Weakening of the dollar can be good for bitcoin and cryptocurrencies in general.
The RSI is falling for several weeks now, but generally maintains an upward trend. For now momentum is still in the hands of buyers .
Gold may jump to $5,000 Gold has been showing rising troughs and peaks for several years now. Buyers are in control price, and gold just reached a new historical high of $4550 . As long as buyers protect the moving averages (9-day/18-day EMA), the price has the potential to continue to rise up to $5000 .
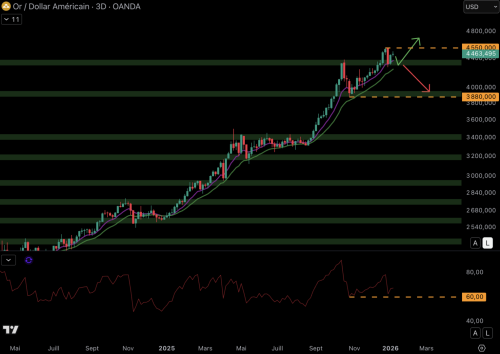
Gold Price Against Dollar (3D) – Sign up for TradingView using our affiliate link.
If the price of gold will hold moving averages and support level at $4350 she can achieve a new historical maximum . However, if the price will weaken and falls below support levels and moving averages, it may return to approx $3900 support level .
Gold, reference asset-harbor, is clearly in demand among investors, and at the moment the probability points to a new bullish phase . However, the RSI is not following the price trend and the decline is lower 60 can provoke bearish divergence . This bearish signal would indicate a loss of momentum for gold.
From April 2025, the index The S&P 500 is trending up . Each retracement to the ascending moving averages (9-day/18-day EMA) triggers further rebounds . The S&P 500 is in a bullish trend and has even reached historical maximum at the beginning of 2026 .
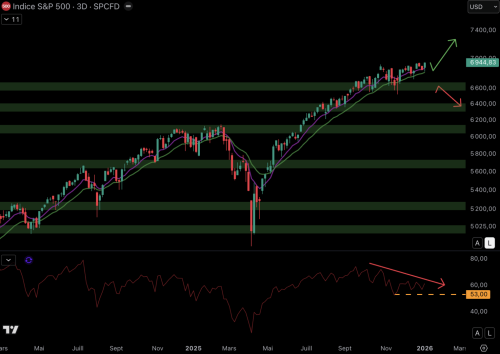
S&P 500 vs Dollar (3D) – Sign up for TradingView using our affiliate link.
If the price continues fluctuate between rising moving averages it may soon reach the psychological mark in 7000 dollars . In the event of a fall, the price may recover to support level at $6650 . However, a break below this support could lead to a return to support of $6,350 . RSI confirmed several bearish divergences and a new divergence can be triggered if the price will fall below 53. The S&P 500 is bullish, but momentum points to weakness.
Key points to remember Bitcoin is recovering and now a bull market seems possible. Meanwhile, gold and the S&P 500 recently hit new all-time highs, giving buyers a significant edge over the two assets. After all, gold, the S&P 500 and Bitcoin could benefit from a weaker dollar. And according to Arthur Hayes, the next important trend may be the protection of privacy.

STEADY LADS $100,000 PORTFOLIO MONITORING Distribution as of 07.01.26:
💵 Stablecoins: 7% — 💰 Cryptocurrencies: 93%
After more than two weeks of inactivity, the market finally offered some profitable opportunities. Thus, several positions were opened at the beginning of the year, which marked a return to almost full investment volume.
📍 Follow Kara’s full portfolio and decisions on Steady Lads in real time
Join the Steady Lads
Please wait…