“Five years of CME futures data shows where bitcoin has, and has not, built meaningful price support.”, — write: www.coindesk.com
One useful way to frame this is by examining the number of trading days bitcoin has spent within specific price bands. The more time the price has spent in a given range, the more opportunity there has been for positions to be built, which can later translate into stronger support.
Data from Investing.com shows clear disparities across price ranges. Excluding the very brief time bitcoin traded at record highs above $120,000, BTC has spent the least amount of time in the $70,000 to $79,999 band, just 28 trading days. Further, it has spent just 49 days in the $80,000 to $89,999 range. By contrast, lower price zones such as $30,000 to $39,999 or $40,000 to $49,999 saw almost two hundred trading days, highlighting how extensively those areas were tested and consolidated.
For most of December, bitcoin has been trading in that $80,000-$90,000 range following its sharp pullback from the October all-time high. That correction has retraced the price back toward an area where the market has historically spent relatively little time, especially when compared with much of 2024, during which bitcoin spent a significant number of days between $50,000 and $70,000. This uneven distribution suggests that support in the $80,000s, and even between $70,000 and $79,999, is less developed than in lower ranges.
 BTC Trading Days (Investin.com)
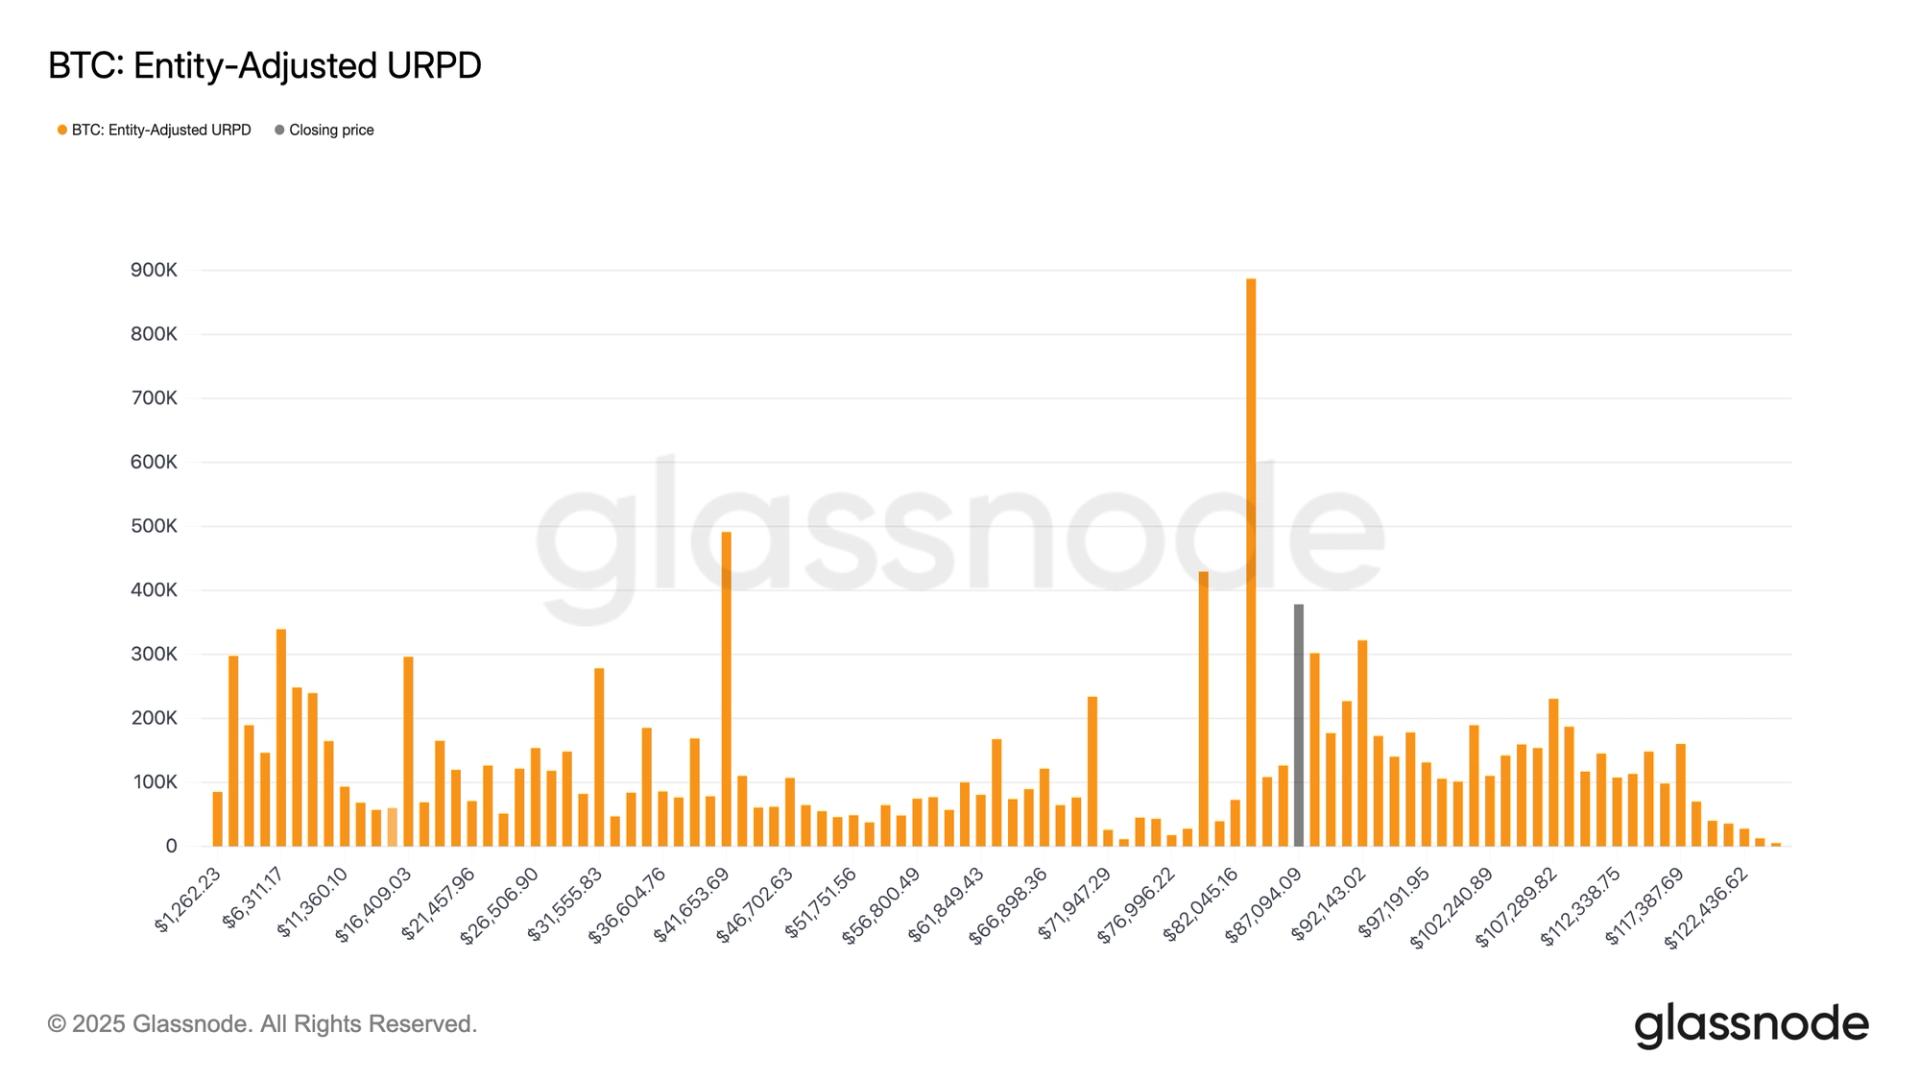
This observation is reinforced by Glassnode data. The UTXO Realized Price Distribution (URPD) shows where the current supply of bitcoin last moved, using an entity-adjusted framework that assigns each entity’s full balance to its average acquisition price.
Disclaimer: This analysis is based on the daily Open price of Bitcoin CME futures, with weekends excluded, meaning the figures reflect how often bitcoin began a trading session within each price band rather than intraday or closing price activity.
 L1 tokens broadly underperformed in 2025 despite a backdrop of regulatory and institutional gains. Explore the key trends defining ten major blockchains below.
This report analyzes the structural decoupling between network usage and token performance. We examine 10 major blockchain ecosystems, exploring protocol versus application revenues, key ecosystem narratives, mechanics driving institutional adoption, and the trends to watch as we head into 2026.
View Full Report
 The biggest single-day exit came from BlackRock’s IBIT, which saw $91.37 million leave the fund. Grayscale’s GBTC followed with a $24.62 million outflow.
- Bitcoin and ether spot ETFs experienced significant outflows on Dec. 24, with traders reducing risk ahead of the Christmas break.
- BlackRock’s IBIT and Grayscale’s GBTC led the bitcoin ETF outflows, while Grayscale’s ETHE saw the largest outflow among ether ETFs.
- Despite the outflows, Grayscale’s Ethereum Mini Trust ETF recorded a notable inflow, highlighting varied investor strategies during low liquidity periods.
Read full story